The U.S. Nursing Shortage by State: 2026 and the Road Ahead


The truth about nursing shortages in United States clinical spaces is that they impact virtually all aspects of healthcare, from emergency response times in rural communities to infection rates in urban hospitals. That gap between available nurses and demand for care is expected to continue widening, with projections estimating a nationwide shortage of more than 250,000 RNs by 2030. To help you understand what this means for your facility, we’ve gathered some key data about the nursing shortage by state, highlighting some of the unique challenges different regions may face now and in the future.
Though the shortage affects healthcare across the country, the severity varies by geographical location. Reviewing nursing shortage statistics by state can provide insights into your facility’s short-term and long-term needs, and give you an idea about what kinds of resources you could engage to continue providing safe, high-quality patient care.
Here’s a look at the forecast for the nursing job market across the different states — and what your facility can do to prepare for it.
Factors Contributing to the Shortage by State and Region
The current nursing shortage is a result of both an increased demand for nurses and a decreased supply of nursing professionals in the workforce. This imbalance creates a workforce scarcity that varies geographically, with a number of cascading impacts to patient care, mental health, nurse job satisfaction, and beyond. Let’s take a closer look at some of the key demand and supply factors that are contributing to this market imbalance in states with nursing shortages.
Aging Population
The fastest growing segment of the population is the “oldest old,” those who are 85 and older. This segment of the population is expected to reach 13.7 million by 2040, more than double the size of that population within this decade.
For nurses, this translates into caring for a growing number of patients who often need the highest levels of clinical support. It also means that in the future, the highest demand for nurses by state may align with demographic makeups that feature higher percentages of geriatric residents, amplifying an already troubling shortage of nurses.
Retiring Nurses
The baby boomer generation (born between 1946 and 1964) will continue to retire through 2030, leading to a significant loss of experienced nurses. In total, an estimated 1 million nurses of all generations are expected to exit the nursing workforce within that timeframe, exacerbating the projected nursing shortage by 2030 and creating a significant hole in the workforce that must be filled by younger nursing professionals and new graduates.
Insufficient Educational Program Capacities
Faculty shortages, fewer clinical site options, and budget constraints limit the capacity of nursing programs, making it increasingly difficult to prepare the next generation of nurses. In fact, between 2024-2025, more than 65,000 qualified candidates were turned away from nursing programs due to operational limitations.
How Does the Shortage of Nurses in the U.S. Affect Facilities?
The effects of the unmet nursing demand (by states and across systems) vary according to patient population, facility type, and the care provided. For example, small rural clinics may face facility closures and limitations to the services offered, while large hospitals may have to contend with higher nurse-to-patient ratios, the use of alternate care delivery models, and the risk of jeopardizing care quality.
Nursing Shortage by State: Key Signs to Watch For
Examining the nursing shortages by state will give you a wide-scope view of the situation, and may answer the question, Is there a nursing shortage in my state? However, nursing shortage graphs rarely identify exact numbers for smaller cities (or townships) and local elements such as regional population densities can also profoundly impact your staffing resources.
For estimates that target your precise location, you may need to observe nursing staff trends and analyze facility data to identify patterns across workforce availability. Common indicators of site-specific nursing shortages may include:
- Consistently heavy workloads for staff nurses.
- Reduced time for patient care.
- Increased rates of medication errors.
- Low patient satisfaction scores.
- Increased rates of hospital acquired infections (HAIs).
- Nursing staff expressions of anxiety, depression, exhaustion, and decreased levels of job satisfaction.
- High nursing staff turnover and increased recruiting expenses.
- Facility closures, restricted hours of operation, or limitations on care provided.
Nursing Shortage by State: A Look at the Numbers
Now that you’re aware of the factors contributing to the nationwide nursing shortage and the indicators to watch for, let’s dive into the numbers. We gathered data illustrating the nursing shortages by state from the Health Resources and Service Administration (HRSA), along with the U.S. Census Bureau, to show you which states are experiencing the highest shortages.
Additional details — like where the highest demand for nurses (by state) exists — may also help your ongoing recruiting efforts in the face of understaffing and competitive hiring. The HRSA predicts demand for nurses based on how the population has utilized healthcare services in the past and their ability to pay for care.
In addition, you can look at trends in the ratio of nurse supply to the projected demand for nurses, or percent adequacy. This metric offers a snapshot of the severity of the nurse surplus or nurse shortage by state, with the lower percentage adequacy indicating a greater shortage of nurses.
| Alabama | 5,193,088 | 61,060 | 11.84 | 55,050 (111%) | 56,430 (112%) |
| Alaska | 737,270 | 9,630 | 13.01 | 6,600 (146%) | 6,980 (133%) |
| Arizona | 7,623,818 | 58,220 | 7.68 | 70,230 (83%) | 76,060 (90%) |
| Arkansas | 3,114,791 | 28,020 | 9.07 | 32,500 (86%) | 32,960 (94%) |
| California | 39,355,309 | 289,820 | 7.35 | 332,410 (87%) | 350,540 (84%) |
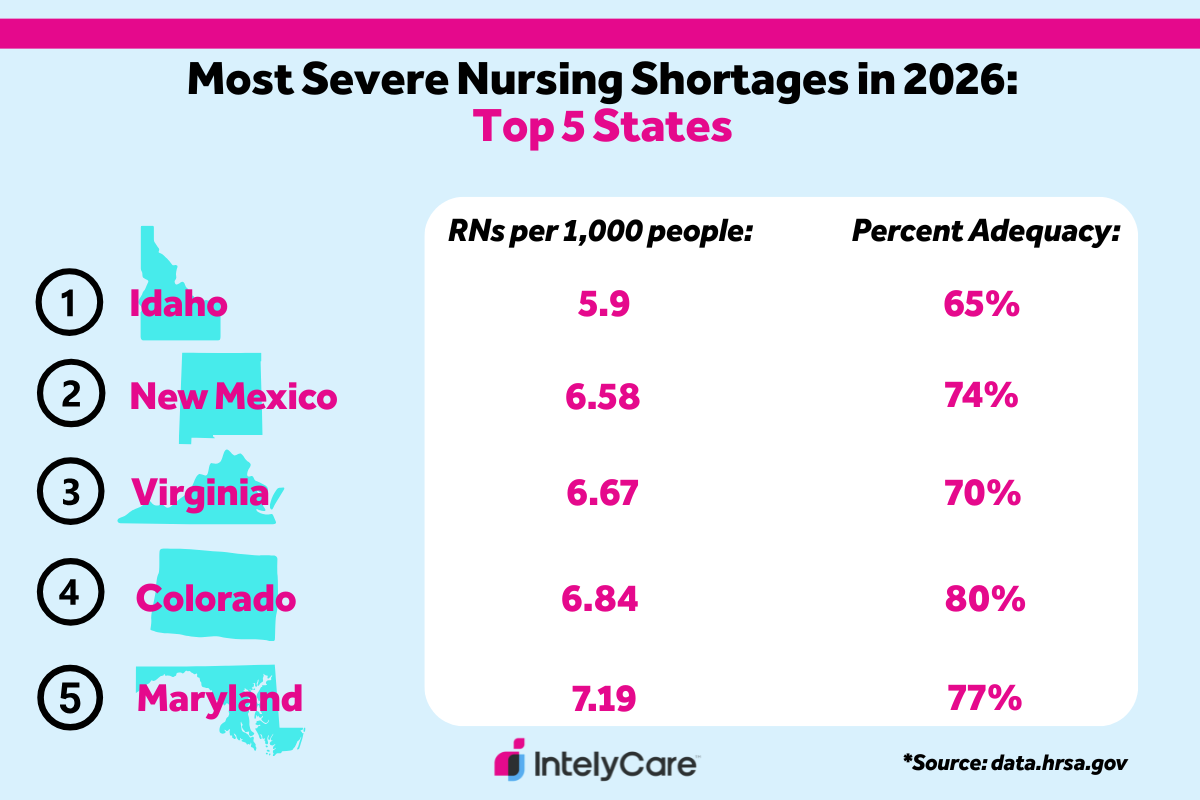
| Colorado | 6,012,561 | 40,730 | 6.84 | 50,700 (80%) | 55,010 (86%) |
| Connecticut | 3,688,496 | 42,500 | 11.56 | 37,320 (114%) | 37,840 (109%) |
| Delaware | 1,059,952 | 1,059,952 | 10.99 | 10,810 (107%) | 11,440 (101%) |
| Florida | 23,462,518 | 214,830 | 9.19 | 229,770 (93%) | 247,650 (94%) |
| Georgia | 11,302,748 | 92,090 | 8.24 | 104,460 (88%) | 112,790 (85%) |
| Hawaii | 1,432,820 | 16,270 | 11.25 | 12,260 (133%) | 12,820 (130%) |
| Idaho | 2,029,733 | 11,800 | 5.9 | 18,100 (65%) | 19,180 (77%) |
| Illinois | 12,719,141 | 131,050 | 10.3 | 121,680 (108%) | 121,710 (107%) |
| Indiana | 6,973,333 | 67,610 | 9.76 | 70,820 (95%) | 72,750 (95%) |
| Iowa | 3,238,387 | 25,410 | 7.84 | 31,700 (80%) | 32,440 (88%) |
| Kansas | 2,977,220 | 25,330 | 8.53 | 28,000 (90%) | 28,700 (98%) |
| Kentucky | 4,606,864 | 43,430 | 9.47 | 52,950 (82%) | 54,710 (89%) |
| Louisiana | 4,618,189 | 37,240 | 8.1 | 49,580 (75%) | 50,610 (79%) |
| Maine | 1,414,874 | 13,620 | 9.69 | 15,240 (89%) | 16,420 (89%) |
| Maryland | 6,265,347 | 45,060 | 7.19 | 58,860 (77%) | 62,100 (78%) |
| Massachusetts | 7,154,084 | 76,060 | 10.66 | 68,270 (111%) | 71,180 (105%) |
| Michigan | 10,127,884 | 87,100 | 8.59 | 104,220 (84%) | 108,020 (81%) |
| Minnesota | 5,830,405 | 60,000 | 10.36 | 55,610 (108%) | 58,250 (108%) |
| Mississippi | 2,954,160 | 24,480 | 8.32 | 32,470 (88%) | 33,110 (92%) |
| Missouri | 6,270,541 | 56,330 | 9.02 | 65,110 (87%) | 66,570 (90%) |
| Montana | 1,144,694 | 11,420 | 10.04 | 11,050 (103%) | 11,520 (106%) |
| Nebraska | 2,018,006 | 17,790 | 8.87 | 19,270 (92%) | 19,940 (98%) |
| Nevada | 3,282,188 | 27,970 | 8.56 | 27,630 (101%) | 28,830 (107%) |
| New Hampshire | 1,415,342 | 12,230 | 8.68 | 14,230 (86%) | 15,360 (87%) |
| New Jersey | 9,548,215 | 81,250 | 8.55 | 85,360 (95%) | 88,010 (93%) |
| New Mexico | 2,125,498 | 14,010 | 6.58 | 19,000 (74%) | 19,500 (82%) |
| New York | 20,002,427 | 184,220 | 9.27 | 189,580 (97%) | 191,010 (97%) |
| North Carolina | 11,197,968 | 91,650 | 8.3 | 109,140 (84%) | 116,420 (83%) |
| North Dakota | 799,358 | 8,940 | 11.22 | 7,560 (118%) | 7,750 (128%) |
| Ohio | 11,900,510 | 123,020 | 10.35 | 124,600 (99%) | 125,810 (104%) |
| Oklahoma | 4,123,288 | 30,140 | 7.36 | 41,670 (72%) | 42,880 (77%) |
| Oregon | 4,273,586 | 42,580 | 9.97 | 41,020 (104%) | 43,870 (99%) |
| Pennsylvania | 13,059,432 | 117,060 | 8.95 | 139,820 (84%) | 145,350 (85%) |
| Rhode Island | 1,114,521 | 12,370 | 11.12 | 11,320 (109%) | 11,580 (109%) |
| South Carolina | 5,570,274 | 43,940 | 8.02 | 55,630 (79%) | 58,360 (82%) |
| South Dakota | 935,094 | 10,610 | 11.47 | 8,950 (119%) | 9,360 (125%) |
| Tennessee | 7,315,076 | 62,950 | 8.7 | 73,080 (86%)) | 76,290 (90%) |
| Texas | 31,709,821 | 239,030 | 7.64 | 253,610 (94%) | 271,920 (93%) |
| Utah | 3,538,904 | 29,010 | 8.28 | 27,270 (106%) | 29,990 (122%) |
| Vermont | 644,663 | 8,960 | 13.8 | 6,490 (138%) | 6,560 (131%) |
| Virginia | 8,880,107 | 58,750 | 6.67 | 84,420 (70%) | 88,180 (78%) |
| Washington | 8,001,020 | 61,820 | 7.77 | 70,970 (87%) | 76,770 (84%) |
| Washington, D.C. | 693,645 | 10,550 | 15.02 | 6,050 (174%) | 3,850 (163%) |
| West Virginia | 1,766,147 | 16,560 | 9.46 | 20,420 (81%) | 20,180 (92%) |
| Wisconsin | 5,972,787 | 61,200 | 10.3 | 57,760 (106%) | 59,270 (108%) |
| Wyoming | 588,753 | 10,750 | 18.3 | 5,300 (203%) | 5,380 (188%) |
*Based on 2025 U.S Census Bureau data
The Road Ahead for Healthcare Facilities: The Impact of the RN Shortage by State
The overview of the nursing shortage by state demonstrates the impact that state borders can have on a facility’s ability to deliver high quality nursing care. The shortage is predicted to continue in 30 or more states, with the highest disparity between supply and demand in states like Idaho, Virginia, and Oklahoma, among others.
Reviewing nurse-to-population ratios offers an additional way to assess for a nurse shortage by state. Using this method, states like Idaho, New Mexico, and Virginia have some of the lowest coverage, suggesting that facilities in these areas may face additional challenges. For states like those listed (and others), the facility impacts may include:
- Longer wait times and care delays.
- Difficulty maintaining safe nursing workloads.
- Unmet hiring targets and chronic understaffing.
- Increased nursing fatigue and burnout due to increasingly unmanageable workflows.
- Patient dissatisfaction and/or harm.
Strategies for Addressing the Nursing Shortage by State
As the baby boomer generation exits the workforce, facilities need to utilize creative solutions to meet staffing needs. According to data on the RN shortage by state, some states have a surplus of nurses, while others face severe shortages and will need to put more effort into recruitment.
Facility managers can work toward maintaining safe staffing ratios by partnering with travel nurse agencies or on-demand healthcare staffing companies to fill open shifts. Strategies for retaining staff are also important, and many facilities use nurse wellness programs to promote a positive and healthy work environment.
More Strategies: Meeting the Demand of High-Acuity Patients
The solution to the nursing shortage, by state and as a whole, is multifaceted, given the multiple factors involved. Facilities that see rising numbers of patients in the “oldest old” demographic may need to address the burden of high-acuity patients on their nursing staff by lowering nurse-to-patient ratios and engaging more resources for staff nurses.
For example, ensuring that your hospital unit has a charge nurse who doesn’t have patient assignments can allow them to focus on being a resource for the rest of the staff. By addressing the burden that sicker, frailer patients have on nurses, facilities can work toward preventing nurse burnout.
Need Help Solving the Nurse Staffing Shortage at Your Facility?
If you’re facing a nursing shortage at your facility, you’re not alone. Our review of the nursing shortage by state shows that many healthcare providers across the country are facing the same challenge. See how you can find the right nurse staffing solution for your facility so you can fill open shifts with ease and continue to provide excellent patient care.